
Harness your chart addiction for good: useful history
No CMTs allowed


In all editions of The Intelligent Investor, Ben Graham and Dave Dodd presented examples of companies trading at disparate multiples with varying financial metrics presented in table format:
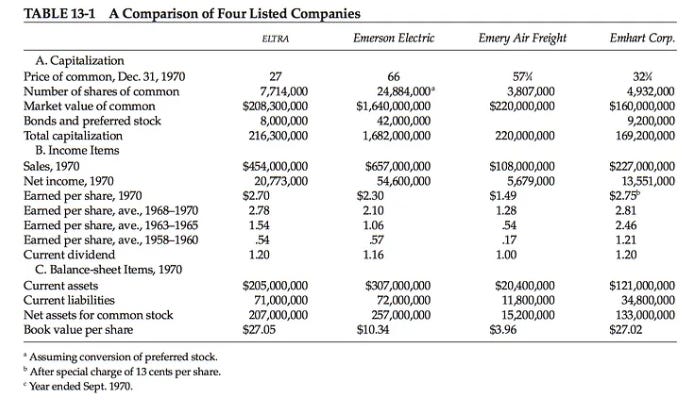
Post-’29 crash, these tables were goldmines. Finding cheap stocks a la Walter Schloss or Ben Graham was as simple as combing through balance sheets. Today these numbers are sorted methodically into factors that trade in lockstep: good vs. bad balance sheet, high earnings variance versus low, low margin vs. high margin, net receivables outstanding accelerating vs. cash flow earnings, free cash flow conversion as a % of EBITDA etc.
It’s remarkable how disparate businesses can trade so correlated to one another based on these factors, but it happens every day. Factors as phenomena are plainly observable and even colloquialized (“dash for trash”). It’s crazy to think about in the context of private market value. Businesses should be compared against very few benchmarks: individual business multiple versus direct industry competitors → industry multiples versus historical industry multiples→ industry multiples versus equity market equity multiple. In other words: is the stock cheap versus competitors (and why)? Is the industry cheap to its history (and why)? Is the industry cheap to the market (and why)? If you don’t have good answers to these questions, you do not have a thesis, you simply have an observation.
ValueLine, GF <GO>
Elegant presentation of data is catnip for the tidy-minded. I am addicted to doing it. I love the idea of looking at 100 years of history of a company’s price-earnings multiple, growth of earnings and revenues, it’s all really interesting. You can overlay geopolitical events, interest rates, commodity prices, anything you’d like and maybe you can see something with prescriptive value (e.g. buy when a company is below x-multiple, sell when it trades up to 2x). But this is more voyeuristic than analytical.
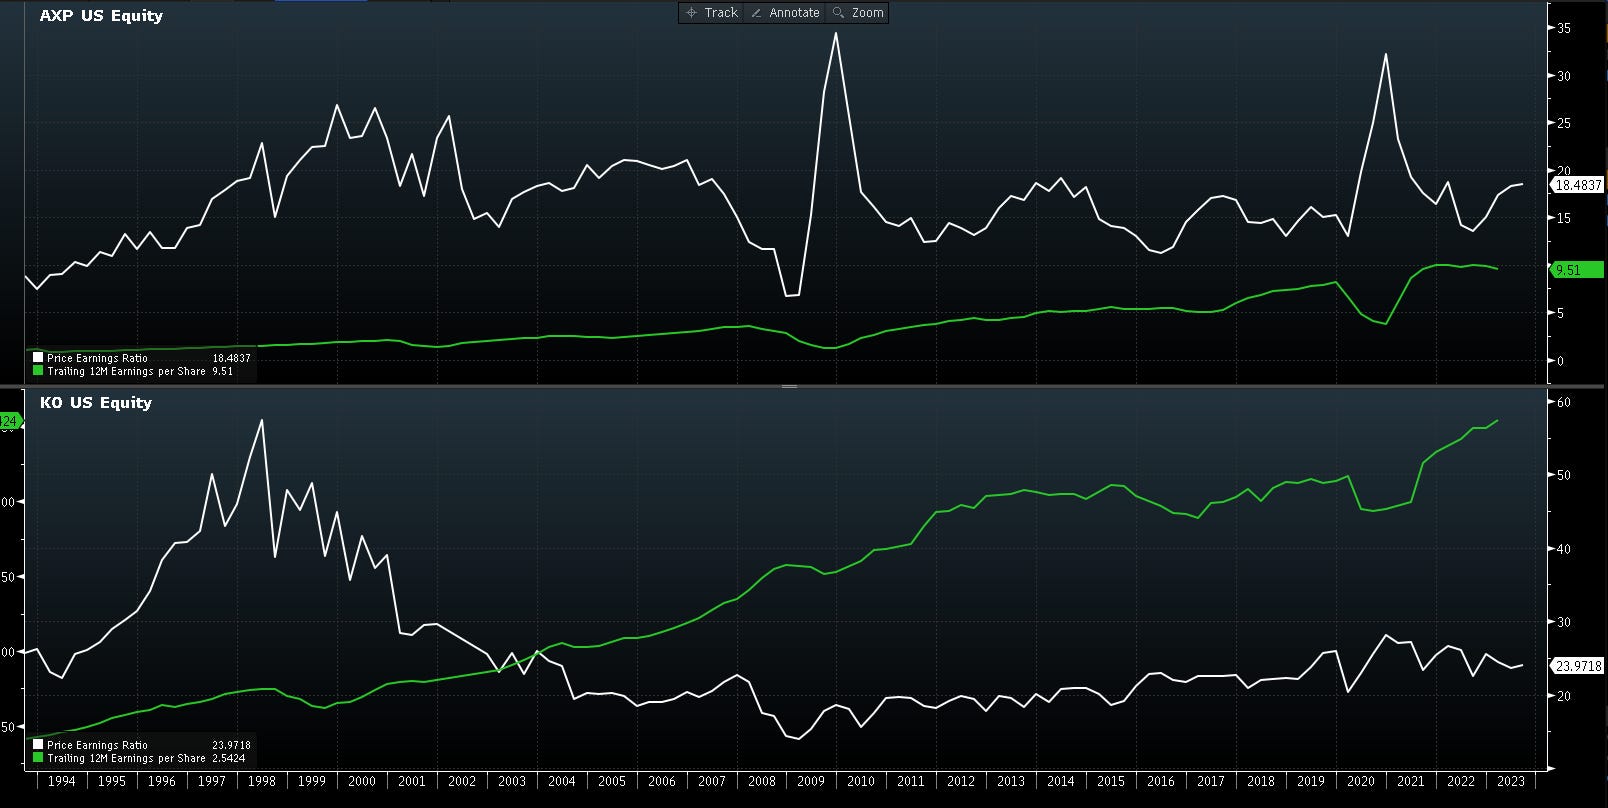
Simply because data is presented in an elegant fashion does not mean it has any useful prescriptive value. For example, Coke spent most of the 1990s trading at >30x. You could have spent a career believing the Coke franchise should trade richer than 30x, only to never see that watermark after 2003. Why and how did this happen? What did Pepsi’s multiple do in that same period? Did the stock still outperform through the de-rating thanks to growth? How many other companies have grown EPS for 30 years straight over that same period?
Anything easily quantifiable and easily sorted is already priced into the market. Going one step further and asking why is where to start. When Buffett bought Washington Post stock in the 1970s it was cheap for a reason: Bebe Rebozo was going after their television licenses through the FCC at the behest of President Nixon! Buffett was making a direct bet that the American president couldn’t put WPO out of business: he got paid handsomely for it. The key is to find the reason, price the risk, and bear that risk, or don’t. Walking away 90% of the time is correct.